How to Manage Processes in Linux: A Practical Guide to ps, top, htop, and Kill Signals
Every command you run on a Linux machine — from a simple ls to a full database server — becomes a process the moment it starts. Understanding how to list, monitor, prioritize, and terminate those processes is one of the first real skills that separates a casual Linux user from someone who can actually keep a server healthy under pressure. This guide walks through the core commands system administrators rely on daily, explains what process states actually mean, and shows where modern tools like htop and btop fit alongside the classics.
Quick answer: In Linux, you manage processes by listing them with ps, top, htop, or btop; controlling them with job-control commands like bg, fg, and jobs; adjusting their priority with nice/renice; and stopping them by sending signals with kill — SIGTERM (15) for a graceful shutdown, SIGKILL (9) only as a last resort.
Table of Contents
- What Is a Linux Process, Really?
- The Four Core Actions You Can Perform on a Process
- Linux Process States Explained
- Foreground and Background Jobs
- Listing and Inspecting Processes
- Visual Process Monitors: top, htop, and btop
- Killing a Process the Right Way
- Adjusting Process Priority with nice and renice
- Common Troubleshooting Scenarios
- Frequently Asked Questions
- Conclusion
What Is a Linux Process, Really?
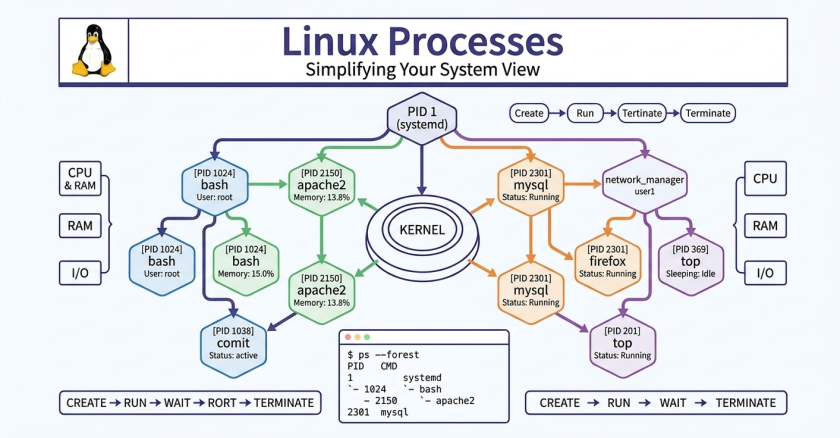
Every running program on a Linux system is assigned a unique Process ID (PID). That process has a parent (the process that launched it), consumes CPU and memory, and moves through a defined lifecycle — from creation to sleeping, running, or eventually dying. Nearly every day-to-day sysadmin task, whether you’re debugging a runaway script or freeing up memory on a production server, comes down to interacting with these processes.
The Four Core Actions You Can Perform on a Process
Almost everything you’ll ever do with a process falls into one of these four buckets:
- List / Monitor — see what’s running and how much of the system it’s using
- Control — move it between foreground and background, pause or resume it
- Kill — terminate it gracefully or forcefully
- Set a priority — tell the scheduler how much CPU attention it deserves relative to other processes
Keeping this mental model in mind makes it much easier to remember which command does what, since Linux’s process tooling has grown organically over three decades and doesn’t always follow a consistent naming pattern.
Linux Process States Explained
Every process sits in one of a handful of states at any given moment:
| State | Meaning |
|---|---|
| R – Running | Actively executing or ready to run on the CPU |
| S – Interruptible Sleep | Waiting for an event (like input), can be woken by a signal |
| D – Uninterruptible Sleep | Waiting on I/O (usually disk); cannot be interrupted, even by kill |
| Z – Zombie | The process has finished, but its parent hasn’t collected its exit status |
The zombie state deserves special attention because it confuses a lot of newer admins. A zombie isn’t a process that’s stuck or misbehaving in the traditional sense — it has already finished executing. What’s left is just an entry in the process table holding its exit code, waiting for the parent process to read it via a system call. If the parent has died or never checks, that zombie entry lingers. A handful of zombies is harmless, but hundreds of them usually point to a poorly written parent application that isn’t reaping its children — and on older kernels, an unbounded number of zombies can eventually exhaust the process table.
A D-state process is worth flagging too, especially on production systems: because it can’t be interrupted, not even kill -9 will remove it while it’s stuck waiting on I/O. If you see D-state processes piling up, the root cause is usually a struggling disk, a hung NFS mount, or a failing storage device — not the process itself.
Foreground and Background Jobs
When you run a command directly in your terminal, it takes over that shell session — this is a foreground job. If you need your terminal back without killing the task, Linux job control lets you suspend and resume it.
# Start a long-running command
$ sleep 1000

# Suspend it without stopping it
# Press CTRL+Z

$ jobs
[1] + suspended  sleep 1000

# Resume it in the background
$ bg %1
[1] + continued  sleep 1000

# Confirm it's really running
$ ps -e | grep sleep
9508 pts/0    00:00:00 sleep

# Bring it back to the foreground
$ fg %1
[1] + running    sleep 1000

# Terminate it cleanly
$ kill -15 9508
This workflow is especially useful when you kick off something long — a backup, a large rsync transfer, a compile job — and realize partway through that you need the terminal for something else. Rather than opening a new session or letting the job block you, CTRL+Z followed by bg frees up the shell instantly.
Listing and Inspecting Processes
The ps command is the workhorse for taking a one-time snapshot of what’s running. A few variations cover almost every situation you’ll encounter:
ps— shows processes tied to your current terminal sessionps -U username— lists everything owned by a specific userps -aux— shows all processes system-wide, including those without a controlling terminalps fax— displays the full process tree with parent-child relationshipsps -eFH— a detailed, full-format listing of every running process
For deeper inspection, a few companion tools round out the toolkit:
lsof -p PID— lists every file a given process currently has open, invaluable when tracking down “file in use” errors or unexpected disk activitypstree -p— renders the parent-child hierarchy visually, which makes it far easier to spot orphaned or unexpectedly nested processes than reading a flatpslistpidof appname— quickly resolves an application name to its PID without scrolling through a full process list
If you need highly specific output for scripting or auditing, ps also accepts a custom format string:
$ ps -eo euser,ruser,suser,fuser,f,comm,label,pid,ppidThis prints the effective, real, saved, and filesystem user IDs alongside the command name, security label, PID, and parent PID — useful when auditing which account a process is actually running as versus what it appears to be running as, a distinction that matters in privilege-escalation investigations.
Show Image Alt text suggestion: “sysadmin monitoring server performance metrics” — search term: “developer laptop code data dashboard”
Visual Process Monitors: top, htop, and btop
ps gives you a snapshot; top gives you a live, continuously refreshing view sorted by resource usage:
top - 14:16:05 up  2:07,  2 users,  load average: 0.00, 0.00, 0.00
Tasks: 122 total,   1 running, 121 sleeping,   0 stopped,   0 zombie
%Cpu(s):  0.0 us,  0.1 sy,  0.0 ni, 99.7 id,  0.2 wa,  0.0 hi,  0.0 si,  0.0 st
MiB Mem :    509.4 total,     69.7 free,    353.8 used,    232.1 buff/cache
MiB Swap:   1995.0 total,   1995.0 free,      0.0 used.    155.6 avail Mem
At a glance, this tells you uptime, load average, task counts by state (including that zombie column), and memory/swap usage — exactly the numbers you’d check first when a server feels sluggish.
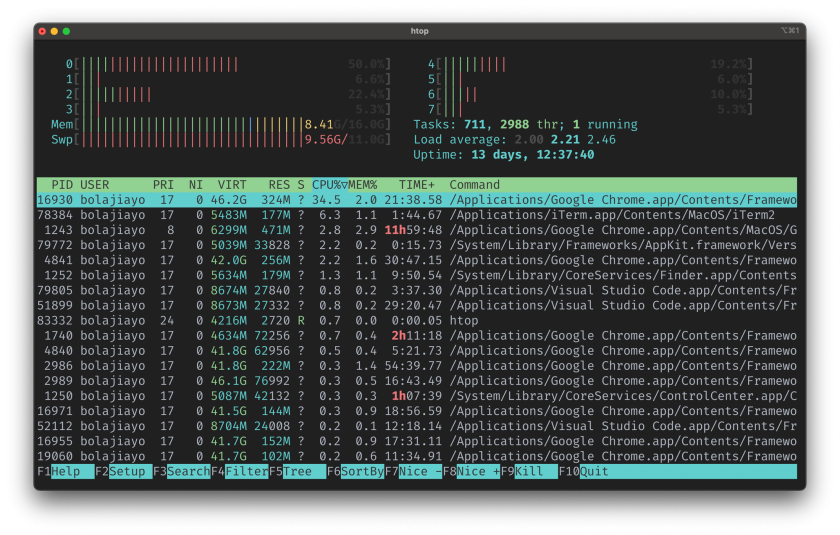
top ships on virtually every Linux distribution and uses almost no resources itself, which is why it remains the default choice for a quick check over SSH. That said, most administrators now reach for something friendlier day to day. Htop is well-suited for administrators who prefer a GUI-like interface in the terminal and want immediate, visually identifiable clues about system performance, and it’s commonly used for interactive troubleshooting and system optimization</cite>. Killing a process, changing its priority, or filtering the list down to a single application name are all a keypress away instead of requiring you to type a PID manually.
For a richer dashboard, btop has emerged as a serious contender in recent years, with a fuller visual layout, GPU monitoring, and mouse support. A practical rule of thumb worth adopting: use btop on workstations and full servers where complete system visibility — including disk I/O graphs — is useful, and stick with htop on lightweight or minimal systems, like containers, where footprint matters more</cite>.
For continuous monitoring of a specific process, watch pairs nicely with ps:
$ watch ps -C dd --format pid,cmd,%cpuThis refreshes the display automatically, which beats re-running ps by hand when you’re watching a value change in real time — for example, tracking CPU usage during a long dd disk-imaging operation.
Killing a Process the Right Way
Ending a process isn’t a single action — it’s a signal sent to it, and different signals produce very different outcomes. Running man 7 signals lists every available signal, but two matter for daily work:
kill -15 PID(orkill SIGTERM PID) — a polite request asking the process to terminate. The process can catch this signal, close open files, save its state, and exit cleanly.kill -9 PID(orkill SIGKILL PID) — a forceful instruction the kernel enforces immediately. The process cannot catch, ignore, or clean up after this signal; it simply stops.
The practical guidance here is straightforward: always try SIGTERM first. Reaching straight for kill -9 skips any cleanup a well-behaved application would otherwise perform — unsaved buffers, temp files, database write-ahead logs — and can leave corrupted state behind. Reserve SIGKILL for processes that genuinely ignore SIGTERM or are stuck in a state where they can’t respond to it.
Adjusting Process Priority with nice and renice
Not every process deserves equal access to the CPU. Linux uses a “niceness” value, ranging from -20 (highest priority) to 19 (lowest), to influence the scheduler’s decisions. A new process’s priority is set with nice, while an already-running process can be adjusted using renice:
$ renice [options] priority [pids]Key options include:
-n/--increment— change the niceness value by the amount given-p— target a specific PID (the default behavior)-g— target an entire process group-u— target every process owned by a specific user
This is particularly useful on shared systems where a batch job or backup script shouldn’t compete for CPU cycles with an interactive application — lowering its priority (raising the nice value) keeps it running without degrading the experience for everyone else.
Common Troubleshooting Scenarios
A few patterns come up repeatedly in real-world administration:
- Server feels slow, no obvious cause — start with
toporhtopsorted by CPU (%CPUcolumn, or F6 in htop) to identify the top consumer before digging further. - Memory usage climbing steadily — sum memory per user with
ps -U username --format %mem | awk '{memory += $1}; END {print memory}'to isolate which account is responsible. - A process won’t die — check its state with
ps. If it showsD, the process is blocked on I/O andkill -9won’t help until the underlying disk or network issue resolves. - Suspicious process running as an unexpected user — cross-check
euseragainstruserwith the customps -eoformat shown above; a mismatch can indicate a privilege-escalation attempt worth investigating immediately.
Frequently Asked Questions
What’s the difference between kill -15 and kill -9?
kill -15 (SIGTERM) asks a process to shut down gracefully and allows it to clean up first. kill -9 (SIGKILL) forces immediate termination with no chance for cleanup, and should be a last resort.
Why can’t I kill a process even with kill -9?
It’s likely in the uninterruptible sleep (D) state, waiting on I/O. No signal, including SIGKILL, can interrupt it until the underlying I/O operation completes or fails.
Are zombie processes dangerous?
A small number are normal and harmless — they’re simply waiting for their parent to read their exit status. A large or growing number of zombies usually indicates a buggy parent process that isn’t reaping its children properly.
Should I use top, htop, or btop?
Use top when you need something guaranteed to be pre-installed and lightweight, htop for daily interactive troubleshooting with a friendlier interface, and btop when you want a full visual dashboard with graphs on a workstation or server where the extra overhead isn’t a concern.
Conclusion
Process management sits at the core of Linux system administration. Listing processes with ps, top, htop, or btop; understanding what states like sleeping, running, and zombie actually mean; controlling jobs between foreground and background; sending the right kill signal; and tuning priority with nice and renice — these are skills you’ll reach for constantly, whether you’re debugging a single misbehaving script or keeping a fleet of production servers healthy. The commands themselves are simple; the judgment about when to use each one is what comes with practice.
Want more articles and tutorials like this?
Get new tutorials, security alerts, and IT tips straight to your inbox.