30 Linux Troubleshooting Commands Every Sysadmin Needs
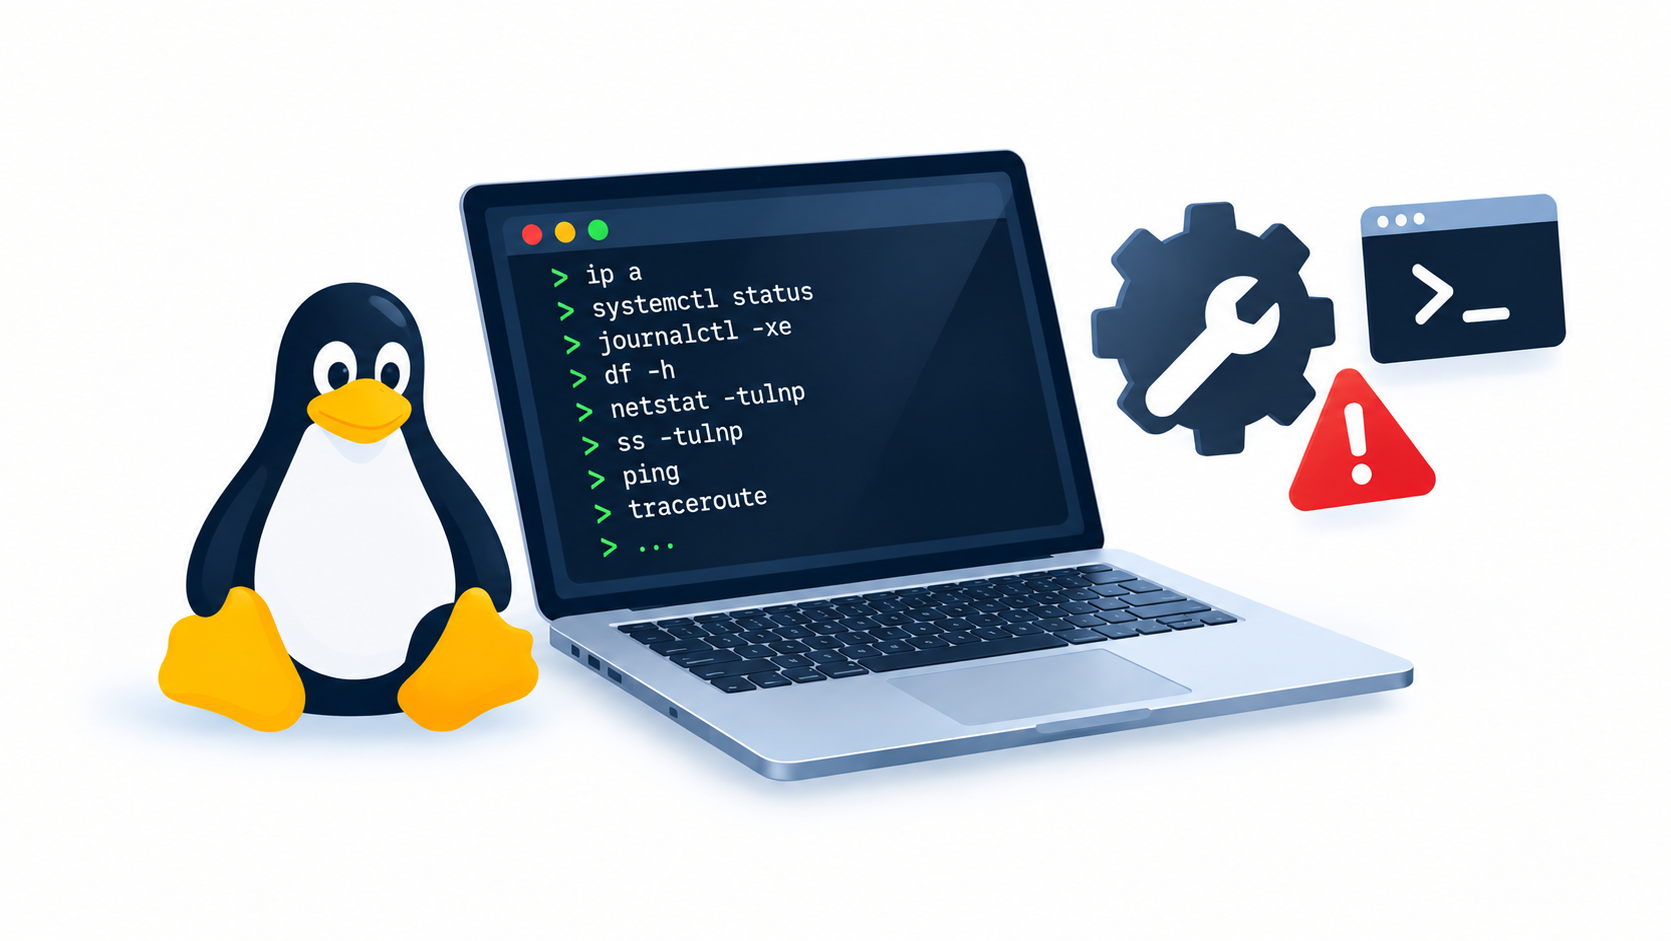
Servers crash at the worst possible times, and when they do, guesswork wastes precious minutes. Every sysadmin builds a personal toolkit of commands that answer the same urgent questions: What’s eating my CPU? Why is disk space gone? Which process won’t die? This guide collects 30 commands that solve real production problems, with practical examples you can run today. Whether you’re new to Linux administration or want a quick reference during an incident, this list covers the essentials.
Table of Contents
- Why These Commands Matter
- System Resource Commands
- Disk and Storage Commands
- Process Management Commands
- Network Troubleshooting Commands
- Log and File Analysis Commands
- System Information Commands
- Putting It All Together: A Troubleshooting Workflow
- FAQ
- Conclusion
Why These Commands Matter
Linux runs most of the world’s servers, so downtime translates directly into lost revenue and frustrated users. Sysadmins can’t wait for a dashboard to load or a support ticket to route when a service goes down. Terminal commands give instant, reliable answers because they query the kernel and filesystem directly, without extra layers that can fail or lag behind.
This list groups commands by the problem they solve, not alphabetically, so you can jump straight to the section that matches your incident. Each command includes a short explanation, a sample use case, and the exact syntax to run.
Suggested image: A terminal window showing system monitoring output — Title: “Linux terminal troubleshooting session” — Alt text: “Sysadmin running diagnostic commands in a Linux terminal”
System Resource Commands
When a server slows down, resource commands identify the bottleneck fast. These six commands cover CPU, memory, and overall load.
1. top
top shows real-time CPU and memory usage per process. It updates every few seconds and sorts by CPU usage by default.
topPress Shift + M inside top to sort by memory instead, or Shift + P to sort by CPU.
2. htop
htop improves on top with color-coded output, mouse support, and easier process control. Most distributions don’t include it by default, so install it first.
sudo apt install htop   # Debian/Ubuntu
sudo yum install htop   # RHEL/CentOS
htop
3. free
free reports total, used, and available memory, plus swap usage. The -h flag makes the output human-readable.
free -h4. vmstat
vmstat gives a snapshot of processes, memory, paging, and CPU activity. Run it with an interval to watch trends over time.
vmstat 2 5This command prints five reports, two seconds apart, so you can spot patterns rather than a single moment.
5. uptime
uptime shows how long the system has run and the load average for the last 1, 5, and 15 minutes.
uptimeA load average consistently above your CPU core count signals the system is overworked.
6. mpstat
mpstat breaks CPU usage down per core, which helps when one core maxes out while others sit idle.
mpstat -P ALL 1 3Suggested image: A split-screen comparison of top and htop outputs — Title: “top vs htop command comparison” — Alt text: “Side-by-side comparison of top and htop CPU monitoring tools”
Disk and Storage Commands
Disk problems cause some of the most common outages: full partitions, runaway log files, or failing drives. These commands find and fix storage issues.
7. df
df reports disk space usage across mounted filesystems. Add -h for readable sizes.
df -h8. du
du calculates the size of directories and files, useful for finding what’s consuming space. Combine it with sort to rank the biggest offenders.
du -sh /var/log/* | sort -rh | head -10This command lists the ten largest items in /var/log, sorted from largest to smallest.
9. lsblk
lsblk lists all block devices — disks and partitions — in a tree structure, showing size and mount points.
lsblk10. iostat
iostat measures disk I/O performance, showing how busy each drive is. It ships with the sysstat package.
sudo apt install sysstat
iostat -x 2 5
High %util values near 100% indicate the disk is a bottleneck.
11. fdisk -l
fdisk -l lists partition tables for all disks, useful when adding new storage or diagnosing partition issues.
sudo fdisk -l12. fsck
fsck checks and repairs filesystem errors. Run it only on unmounted partitions to avoid data corruption.
sudo umount /dev/sdb1
sudo fsck /dev/sdb1
Process Management Commands
Runaway or zombie processes drag down performance. These commands help you find, inspect, and stop them safely.
13. ps
ps lists running processes. The common combination aux shows every process with detailed columns.
ps aux | grep nginx14. kill
kill sends a signal to a process, most often to terminate it. Use the process ID (PID) from ps or top.
kill -9 1234-9 forces an immediate stop. Try kill without a signal number first, since it asks the process to shut down gracefully.
15. killall
killall stops all processes matching a name, which saves time when multiple instances run.
killall firefox16. pkill
pkill works like killall but supports pattern matching for more flexible targeting.
pkill -f "python3 app.py"17. lsof
lsof lists open files and the processes using them. It’s the go-to command when a file or port won’t release.
sudo lsof -i :8080This example finds which process holds port 8080 open.
18. nice and renice
nice sets a process priority when starting it; renice changes the priority of a running process.
nice -n 10 ./backup_script.sh
renice -n 5 -p 1234
Network Troubleshooting Commands
Network issues range from a single failed connection to a full outage. These commands isolate where the problem lives.
19. ping
ping tests basic connectivity to a host and measures response time.
ping -c 4 google.com20. traceroute
traceroute maps the path packets take to a destination, revealing where delays or drops happen.
traceroute google.com21. ss
ss replaces the older netstat and shows active sockets and listening ports.
ss -tulnp22. netstat
Many systems still include netstat for compatibility. It serves the same purpose as ss.
netstat -tulnp23. dig
dig queries DNS servers directly, helping diagnose domain resolution problems.
dig example.com24. curl
curl tests HTTP endpoints and downloads content, useful for checking if a web service responds correctly.
curl -I https://example.comThe -I flag fetches only the response headers, which speeds up quick checks.
25. nmap
nmap scans hosts for open ports and services. Use it responsibly and only on systems you manage.
nmap -p 1-1000 192.168.1.1Suggested image: A network diagram with traceroute hops — Title: “Traceroute network path visualization” — Alt text: “Diagram illustrating how traceroute maps network hops between servers”
Log and File Analysis Commands
Logs hold the story of what happened before a failure. These commands search and follow logs efficiently.
26. journalctl
journalctl reads the systemd journal, the central log for modern Linux distributions.
journalctl -u nginx.service --since "1 hour ago"27. tail
tail shows the end of a file and, with -f, follows new lines as they’re written — ideal for watching a log in real time.
tail -f /var/log/syslog28. grep
grep searches text for matching patterns, essential for filtering large log files.
grep -i "error" /var/log/nginx/error.logSuggested image: A terminal showing grep filtering log output — Title: “Filtering Linux logs with grep” — Alt text: “Terminal screenshot demonstrating grep searching error logs”
System Information Commands
29. uname
uname -a prints kernel version, architecture, and hostname in one line — useful when confirming compatibility.
uname -a30. dmesg
dmesg prints kernel ring buffer messages, which capture hardware events, driver errors, and boot-time issues.
dmesg | tail -50Pipe it through grep to search for specific hardware, such as dmesg | grep -i usb.
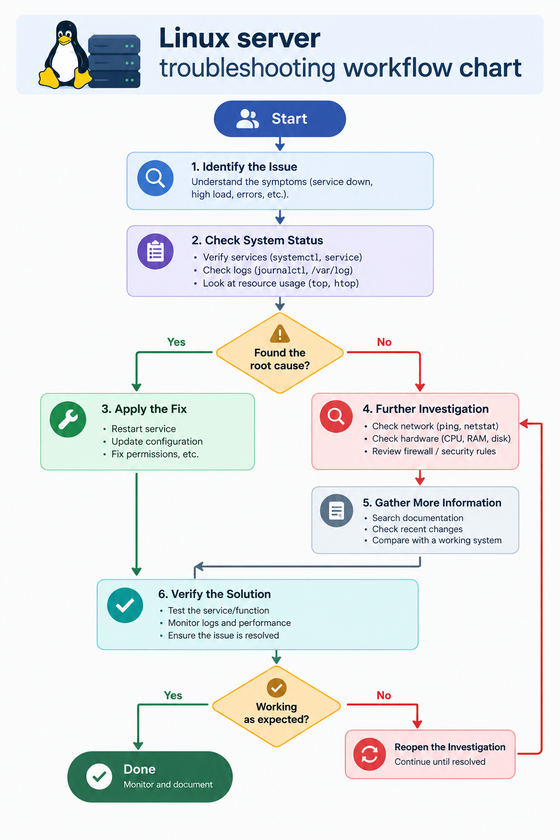
Putting It All Together: A Troubleshooting Workflow
A server slowdown rarely announces its cause upfront, so a repeatable workflow saves time:
- Check overall load with
uptimeandtop. - Confirm memory isn’t exhausted with
free -h. - Rule out disk space problems with
df -h. - Inspect disk I/O with
iostatif storage looks busy. - Identify the specific process with
ps auxorhtop. - Check network connectivity with
pingandssif the app can’t reach a dependency. - Read recent logs with
journalctlortail -fto find error messages.
Running through these steps in order narrows down most incidents within a few minutes.
Common Mistakes to Avoid
New sysadmins often jump straight to kill -9 without checking why a process hangs in the first place. Force-killing a process can leave behind corrupted files or orphaned database connections, so it’s worth pausing to read logs first. Another common mistake is ignoring swap usage — a system can show “enough” free memory while heavily swapping, which slows everything down even though free -h looks fine at a glance.
Skipping the disk check is another frequent error. A full /var partition can silently break logging, package installs, and even SSH access, yet it rarely shows up as the obvious first symptom. Running df -h early in any investigation avoids wasted time chasing the wrong lead.
Finally, avoid running unfamiliar commands directly on production systems. Test destructive commands like fsck or renice on a staging environment first, so you understand their behavior before using them where downtime actually matters.
FAQ
Q: Which command should I run first during a server outage? Start with top or htop to get an immediate view of CPU and memory usage. This quickly tells you whether the bottleneck is resource-related or something else, like a network or disk failure.
Q: What’s the difference between kill and kill -9? Plain kill sends a termination request that lets the process clean up and exit gracefully. kill -9 forces an immediate stop without cleanup, so use it only when the process refuses to respond to a normal kill.
Q: How do I find which process is using a specific port? Run sudo lsof -i :PORT_NUMBER, replacing PORT_NUMBER with the port you’re checking. The output shows the process name and PID holding that port open.
Q: Is netstat outdated? Most distributions now recommend ss because it’s faster and provides more detail. netstat still works and remains available for compatibility, so both are worth knowing.
Q: Can these commands damage my system? Most are read-only and safe to run anytime. Commands that modify state — kill, fsck, renice — need care. Always double-check the PID or device before running them, and avoid running fsck on a mounted filesystem.
Q: Do I need root access for all of these? No. Commands like top, ps, df, and ping work for any user. Others, such as lsof -i, fsck, and package installs, need sudo because they touch system-level resources.
Conclusion
These 30 commands cover the core of Linux troubleshooting: resource monitoring, disk management, process control, network diagnostics, and log analysis. Keeping this list handy, or bookmarking it, means less time spent searching for the right syntax during an actual incident. Practice these commands on a test system before you need them in production, so the workflow feels natural when pressure is high. With this toolkit, most Linux issues become a matter of methodical checking rather than guesswork.
Want more articles and tutorials like this?
Get new tutorials, security alerts, and IT tips straight to your inbox.
My old system had a specific kernel version where the standard commands failed to identify the memory leak properly.