Linux Tip: How to Find the Process Consuming the Most Memory on Your Server
               total        used        free       shared     buff/cache   available
Mem:            16Gi        9.2Gi       1.1Gi       450Mi       5.7Gi       6.1Gi
Swap:          2.0Gi        256Mi       1.7Gi
Here’s what the columns mean:
- Total: Total installed RAM.
- Used: Memory currently in use.
- Free: Completely unused memory.
- Buff/cache: Memory Linux uses for filesystem caching and buffers.
- Available: Estimated memory available for new applications without swapping.
Important: Linux uses available RAM for caching to improve performance. Therefore, low free memory does not necessarily indicate a memory problem. Pay closer attention to the available value.
2. Find the Processes Consuming the Most Memory
This is the command every Linux administrator should know:
ps aux --sort=-%mem | headIt displays the processes consuming the most memory, starting with the highest.
Example output:
USER      PID  %CPU  %MEM    VSZ    RSS COMMAND
mysql    1520   2.1  25.4  4200m  4100m mysqld
root     2100   1.5  18.2  3000m  2900m java
www-data 3200   0.8   8.5  1500m  1360m php-fpm
root     1100   0.2   3.2   800m   512m nginx
The most important columns are:
- PID: Process ID.
- %CPU: CPU consumption percentage.
- %MEM: Percentage of physical RAM used.
- VSZ: Virtual memory size.
- RSS: Resident memory currently occupying physical RAM.
In this example, MySQL is consuming the most memory, followed by Java.
This information helps you identify which application deserves further investigation.
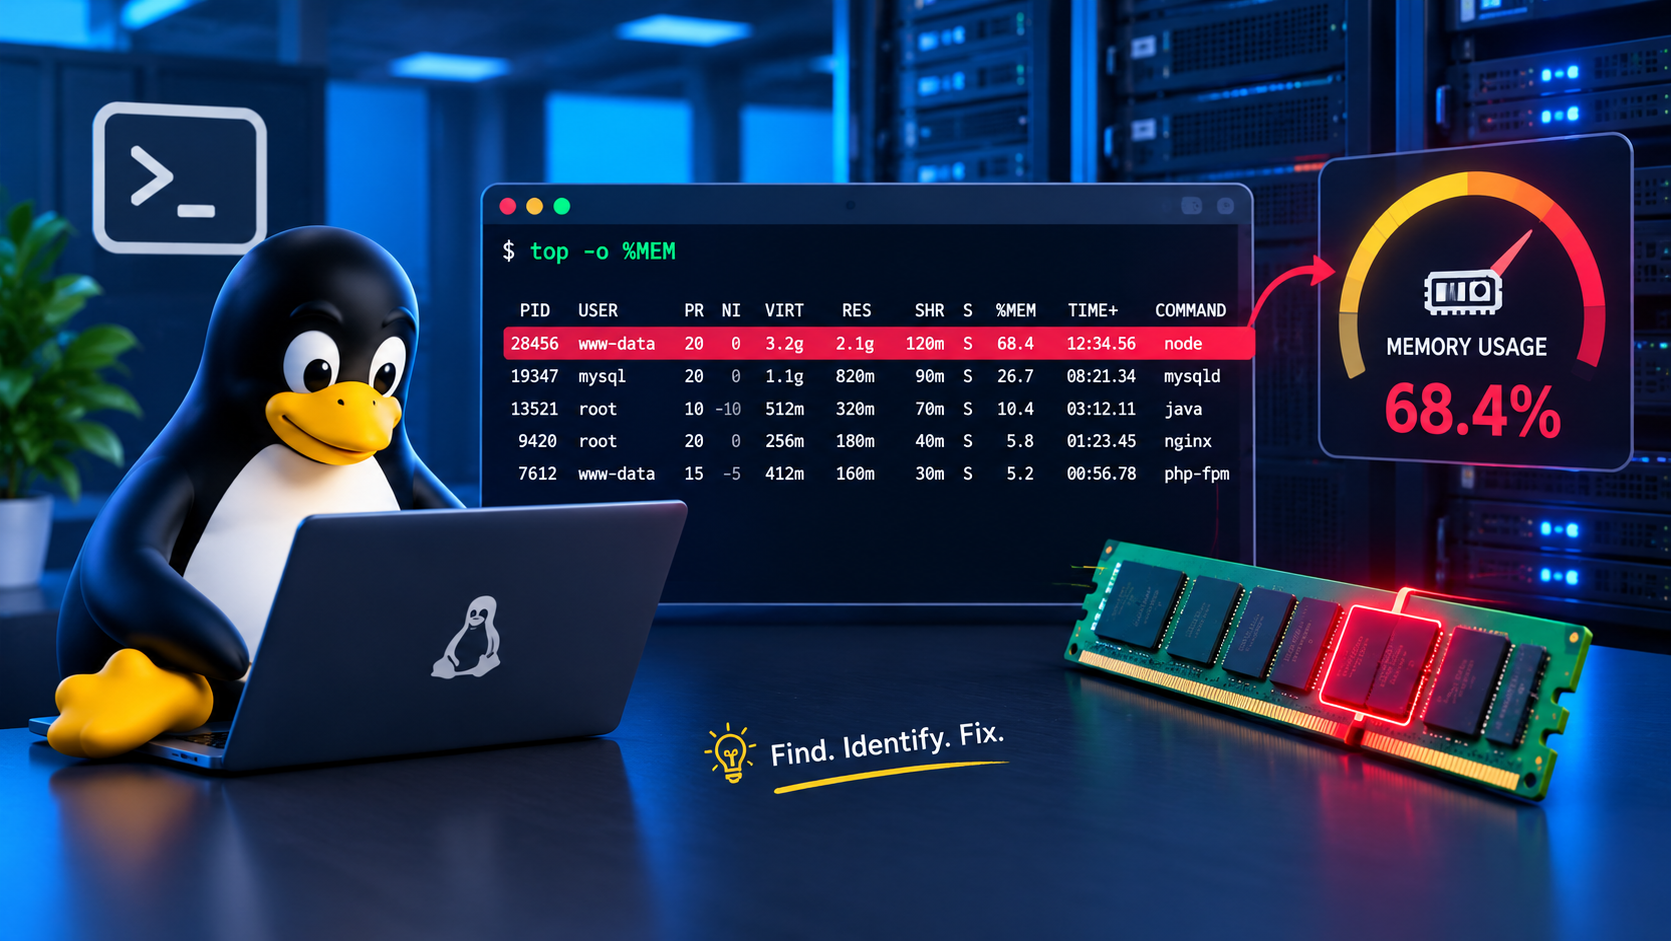
3. Monitor Memory Usage in Real Time with top
If you want to monitor memory consumption continuously, use:
topThe top utility displays running processes and their resource consumption in real time.
Inside top, press:
- M: Sort processes by memory usage.
- P: Sort processes by CPU usage.
- 1: Display individual CPU cores.
- q: Exit.
This is particularly useful when investigating applications whose memory consumption changes frequently.
4. Use htop for Better Visualization
If you prefer a more user-friendly interface, try htop.
Install it depending on your Linux distribution.
Ubuntu / Debian:
sudo apt update
sudo apt install htop -y
RHEL / Rocky Linux / AlmaLinux:
sudo dnf install htop -yLaunch it:
htopYou will see:
- CPU usage per core.
- RAM and swap consumption.
- Running processes.
- Process IDs.
- Resource consumption in real time.
You can press F6 to change the sorting method and select memory usage.
5. Display Memory Usage in Megabytes
Sometimes you need a cleaner output for troubleshooting or reporting.
Use:
ps -eo pid,comm,%mem,rss --sort=-rss | head -10This displays the 10 processes using the most physical memory.
The RSS column is expressed in kilobytes.
To display memory in megabytes:
ps -eo pid,comm,%mem,rss --sort=-rss | awk 'NR==1 {print; next} {printf "%-8s %-20s %-8s %.2f MB\n", $1, $2, $3, $4/1024}' | head -10This is useful when you want to quickly identify memory-intensive applications without opening an interactive monitoring tool.
6. Identify Memory-Hungry Processes Automatically
You can also create a simple Bash command to report the five processes consuming the most memory.
#!/bin/bash

echo "Top 5 Memory-Consuming Processes"
echo "--------------------------------"

ps -eo pid,comm,%mem,rss --sort=-rss | head -6
Save the script:
nano memory-check.shMake it executable:
chmod +x memory-check.shRun it:
./memory-check.shThis script can be useful during routine server administration and troubleshooting.
7. What to Do If a Process Consumes Too Much RAM
Finding the process is only the first step. You also need to understand why it consumes so much memory.
Here are some recommended actions:
1. Investigate the application
Check its logs and configuration. For example, if MySQL consumes too much memory, investigate its buffer pool and connection settings.
2. Check whether memory usage keeps increasing
A process that continuously consumes more memory may have a memory leak.
Monitor it over time rather than immediately assuming that high memory usage is abnormal.
3. Check application activity
An unexpected number of connections, background jobs, or requests can increase memory consumption.
4. Restart only when necessary
Restarting a service may temporarily release memory, but it does not solve the underlying problem.
Avoid killing critical processes without understanding their role and potential impact.
8. Frequently Asked Questions
Which Linux command shows the process using the most memory?
Use:
ps aux --sort=-%mem | headIt lists processes in descending order of memory consumption.
How can I see memory usage in real time?
Run:
topPress M to sort processes by memory usage.
Alternatively, use htop for a more visual interface.
What is the difference between RSS and VSZ?
- RSS: Physical memory currently occupied by a process.
- VSZ: Total virtual address space allocated to a process.
RSS is generally more useful when investigating physical RAM consumption.
Does high memory usage always indicate a problem?
No. Linux uses available memory for caching, and applications may legitimately require substantial RAM.
Investigate whether the server experiences swapping, performance degradation, or memory exhaustion before taking action.
How can I check whether my Linux server is using swap?
Run:
free -hLook at the Swap section to see total, used, and available swap memory.
Conclusion
Monitoring memory consumption is an essential part of Linux server administration. Identifying resource-hungry processes helps administrators troubleshoot performance issues, prevent memory exhaustion, and maintain server stability.
If you remember only one command from this guide, make it:
ps aux --sort=-%mem | headIt gives you a quick overview of the processes consuming the most RAM without installing additional software.
A healthy Linux server isn’t just about having enough RAM; it’s also about understanding how applications use it.
Finished this Linux tutorial? Get the next one first.
Every week we send one hands-on Linux guide with the exact commands, the output you should see, and the mistakes to avoid.
- Step-by-step Linux & SysAdmin guides
- Ready-to-use commands and scripts
- New lab walkthroughs
No spam. Unsubscribe anytime.